Le contenu de cette page nécessite une version plus récente d’Adobe Flash Player.

Obtenir le lecteur Adobe Flash

Credits

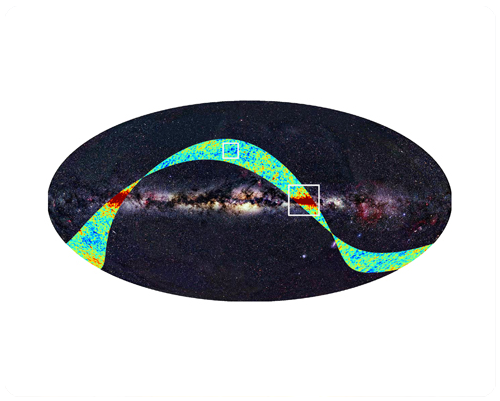
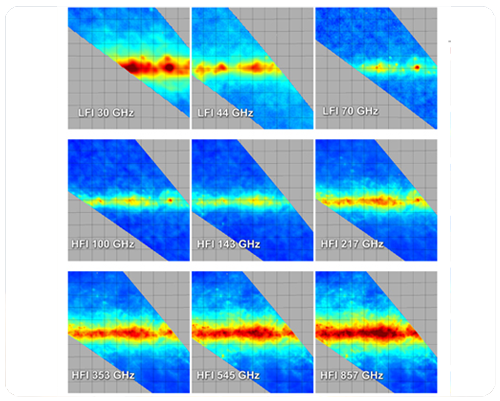
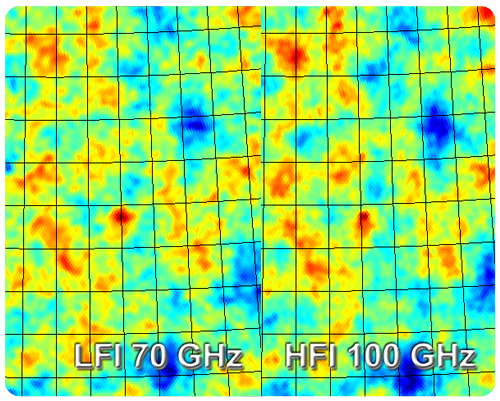
Picture one :
Satellite: Planck
Depicts: First light survey superposed on an all-sky map
Copyright: ESA, LFI & HFI Consortia (Planck), Background image: Axel Mellinger


Picture two :
Satellite: Planck
Depicts: Mosaic of maps at 9 different frequencies, showing part of the Milky Way Copyright: ESA, LFI & HFI Consortia (Planck)


Picture three :
Satellite: Planck
Depicts: Map of the high-galactic-latitude sky at 70 and 100 GHz, detail from the Planck First Light Survey Copyright: ESA, LFI & HFI Consortia (Planck)

Le contenu de cette page nécessite une version plus récente d’Adobe Flash Player.

Obtenir le lecteur Adobe Flash

Planck First Light Survey
September 17, 2009
planck
A map of the whole sky at optical wavelengths shows a prominent horizontal band ...

A map of the whole sky at optical wavelengths shows a prominent horizontal band. The superposed false-colour strip shows the area of the sky mapped by Planck during the First Light Survey. The colours indicate the magnitude of the deviations of the temperature of the Cosmic Microwave Background from its average value, as measured by Planck at a frequency close to the peak of the CMB spectrum (red is hotter and blue is colder). The large red strips trace radio emission from the Milky Way, whereas the small bright spots high above the galactic plane correspond to emission from the Cosmic Microwave Background itself.


planck

The two squares indicate the location of the detailed images shown in the other figures from the Planck First Light Survey released on 17 September 2009 (see "Planck first light yields promising results" in right-hand menu).

Planck First Light Survey - detail of the Milky Way at nine frequencies

planck

The above mosaic of maps zooms in on a small part of the First Light Survey, in which our own Milky Way shines very brightly. The nine panels show a 20°×20° map of the emission imaged by Planck in each of the nine frequencies that it is sensitive to: 30 GHz (top left) to 857 GHz (bottom right). Each strip is slightly offset from the others due to the arrangement of the detectors in the focal plane.

At low frequencies electrons in the Milky Way emit radio waves as they interact with gas and the magnetic field; at high frequencies it is dust that radiates heat. At each frequency a different mix of radiation processes contributes to the structure visible in the images; the combination of frequencies provides a rich source of information on the physics of our Milky Way – much of it never available until now.

(Note that each panel is available as a separate image - see Related Images.)


Planck First Light Survey - detail at high galactic latitude

planck

This zoom on an approximately 10°×10° region of the Planck First Light Survey where the Milky Way is not the predominant signal shows clearly the features which are of most interest to Planck, i.e. the Cosmic Microwave Background (CMB).

In the left and right panels are observations by LFI at 70 GHz and HFI at 100 GHz, respectively. At each of these frequencies the dominant emission is the CMB, and both maps indeed show very similar features. The small visible differences are expected, due to the still imperfect calibration at this early stage of processing, and to remaining low-level galactic emission.

The fact that two completely independent detectors based on different technologies are so quickly able to yield maps of such remarkable similarity is a powerful confirmation of Planck's ability to detect and map the very faint CMB structures arising in the early Universe.


sciences

Beyond the standard model

Astroparticle physics

Cosmology

Gravitational waves experiments

Astrophysics

Neutrinos

cosmovia.org

in the News

Applications

Facebook

Partners of VIA

Contact

help

How to use VIA

cosmovia_trait

©2010 COSMOVIA - All Rights reserved